Tutorial – Live Objects Pipelines+Orange Node-RED SaaS: transform & enrich your Business data
Want to enrich your IoT data with external data or transform it before injection in Live Objects ? It's the big easy and codeless! You can use the Orange Node-RED service and the Live Objects Pipelibes. Learn how with our tutorial.
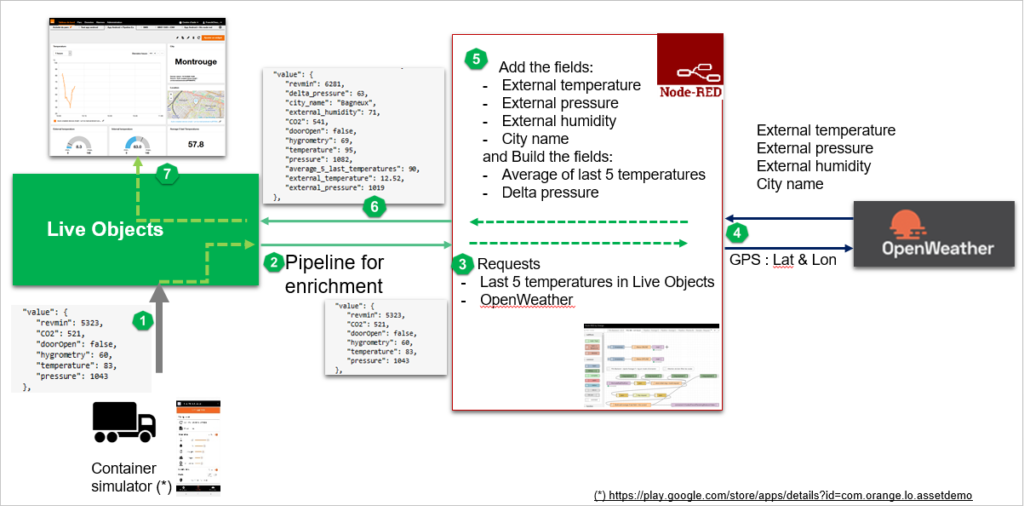
This tutorial details how to build an end to end codeless IoT service based on Live Objects Pipelines + the new Orange Node Red SaaS service. This service can be easily demonstrated with free tools. It will answer to the following use case :
My pressurized chemical containers travel from Paris to Lille
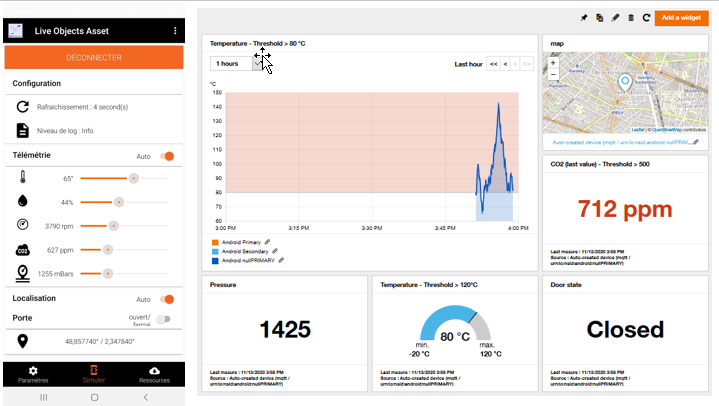
I want to know their location and their functioning telemetry: temperature, pressure, fan activity (rpm), hygrometry, CO2 level, door status
But I want also to
- follow the average of the 5 last internal temperatures
- know external data at the container location: temperature, hygrometry, pressure
- know the inside vs outside delta pressure
- see in what town the containers are located
What you need
- An Android smartphone with the Live Objects demo app “Live Objects Asset” : https://play.google.com/store/apps/details?id=com.orange.lo.assetdemo
- A free discover account in Live Objects : (don’t ask for connectivity, it will work on your smartphone WiFi or cellular data)
- A free Orange node red account: submit a request at liveobjects.support@orange.com
Step 1: setup your android application and create your first widgets.
After having watched this tutorial (in French but with English subtitles) , to start with Live Objects you will be able to:
- Create a “MQTT device” API key and scan/input it into your “Live Objects Asset” Android application.
- Check the upcoming payloads into the Live Objects data zone
- Create dashboards and widgets
You now have your container simulator which will send its business data to your Live Objects account.
You can build a dashboard showing the incoming real time data: temperature, pressure, fan activity (rpm), hygrometry, CO2 level, door status
Step 2: understand your Node-RED credentials
Your Orange node red subscription will provide you a portal uri, user and API credentials:
- Id: “your-id”
- 2 users : “node-red-rw”:”rw_key”, “node-red-ro”:”ro_key”
- A server uri: https://node-red-1-nodered-enabler-prod.eu-b.kmt.orange.com/node-red/ui/your_id
- API id/key: “node-red-api”: “api_key”
- API uri: https://node-red-1-nodered-enabler-prod.eu-b.kmt.orange.com/node-red/api/your_id
Step 3: enrich/transform your business data with the Live Objects pipelines
Live Objects allows you to enrich/transform your business data in 2 ways:
- Using the pipelines: once the data payload is received and decoded, and before it is stored and indexed, the pipeline sends the data to an external server (node red in this case) which will transform it. This is what we will do in this article.
- Using Fifo or Http Push towards a backend: we will detail this in another article.
For more information about pipelines see this article: https://blog.liveobjects.orange-business.com/enrich-transform-or-decode-your-data-before-storage/
In the Live Objects portal, go to the menu Data/Custom pipelines
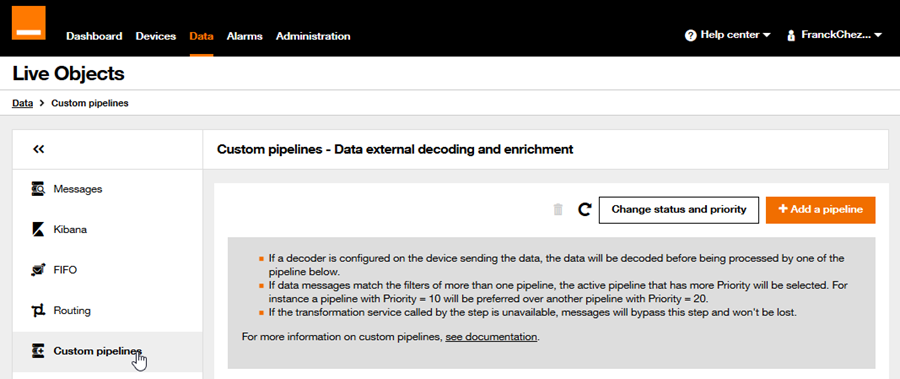
Then add a pipeline

In my case I will only enrich the devices from the “demo” group

Put your node red api url + your flow entry point, here “/addaverageEx”
Add the Authorization header: it will be “Basic “ + your 64 based encoded node red api_key with this format: “node-red-api:api_key” (use https://www.base64encode.org/)
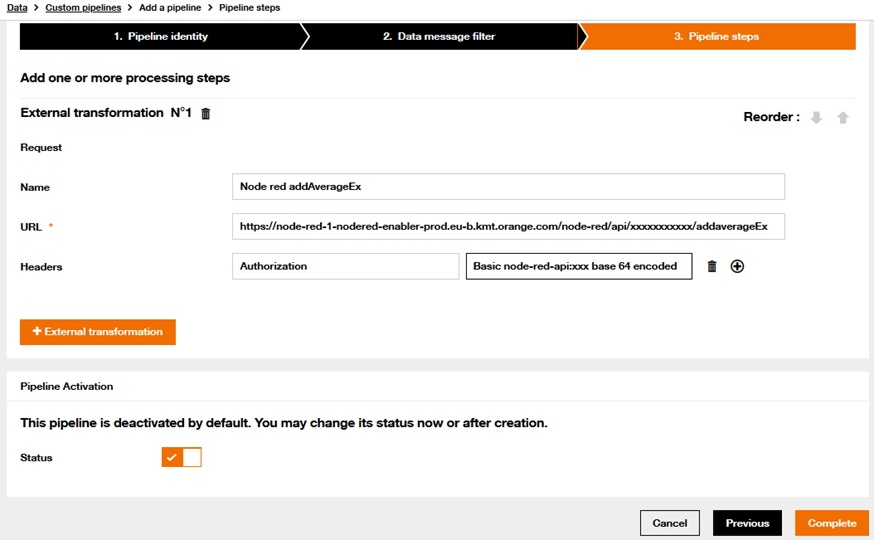
Your pipeline is now configured and should look like something like this:

… And Live Objects is ready to transform the incoming data through a node red flow.
Step 4: Build your Node-RED flow
Create your Open Weather (https://openweathermap.org/) account and get your API key.
Create an ‘application’ API key in your Live Objects account
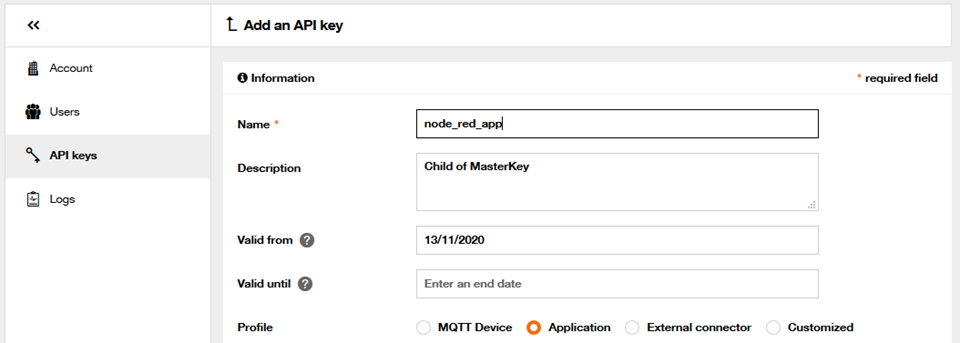
Download the node red transformation flow here, do not forget to change txt into json extension
Click to enlarge
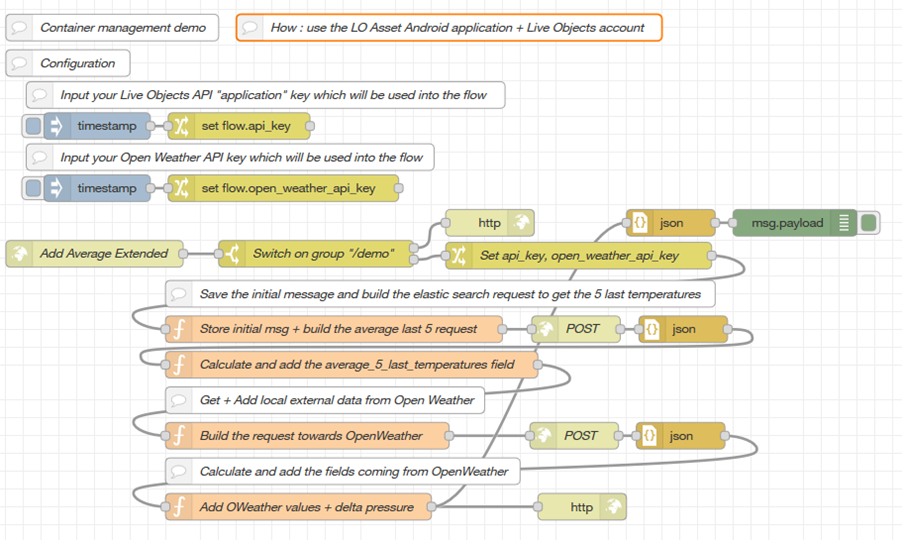
Configure your flow: you have to set 2 API keys
- The Live Objects ‘application’ key
- The Open Weather API key

Your flow is now ready to enrich the incoming data.
That’s all folks !!!
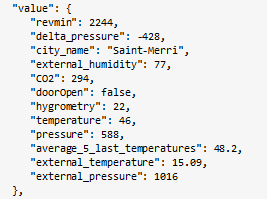
You can now see in Live Objects enriched payloads with new fields (external_humidity, external_pressure, external_temperature, average_5_last_temperature, delta_pressure, city_name).
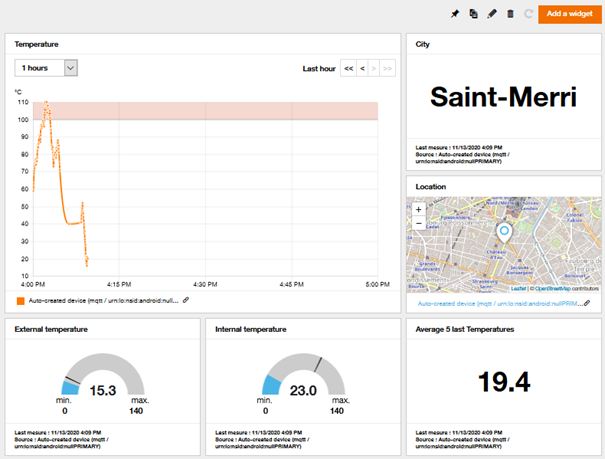
… And you can create new widgets into your dashboard
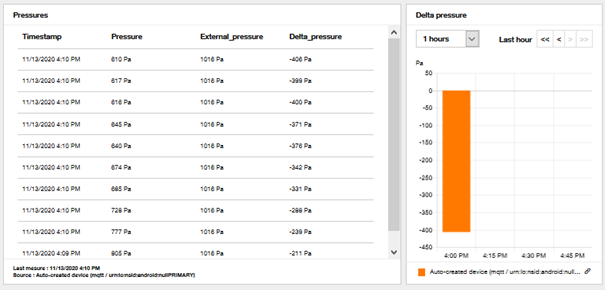
Let’s summarize what we have done (click to enlarge)
Next time
In next articles we will detail
- how to trigger events and actions (ex: alert SMS)
- how to manage backend processing through Fifo or Http Push and inject transformed data into Live Objects

 B2B "IoT enthusiasts" group
 Tutorials
 Orange Business