Common issues 2/5: how to troubleshoot LoRa connectivity problems?
Connectivity issues may have plenty of causes and could be tricky to troubleshoot. Typically it can comes from a problem of network coverage, a problem of local environment or a problem of device implementation. Fortunately Live Objects provides useful tools to investigate such problems
Live Objects provides useful tools to investigate those connectivity problems:
- The Activity Logs where you can track all exchanges between you device and the network
- Kibana (an option of LoRa premier offer) with which you can explore the network metadata of message issued by your devices who contains a lot of network indicators
The Activity Logs are accessible in the Live Objects portal (in “Administration” menu). You can filter your device to see what happen:
- Your device is not communicating? First check if it has issued a Join Request and received a Join Accept from the network. Then check if it issued a data uplink ?
- Your device seems not receiving a command from Live Objects ? Check if you find a downlink
- You are able also to check if uplink and downlink are done in confirm or unconfirmed mode, and then if confirmation is done properly (ack bit = true)
- You can also consult the details of each frame to see if it is normal or not
- Also the Activity Logs traces all network requests coming from the LoRa network (MAC) that can have an impact on the device behavior: LinkADRReq, DevStatusReq… See Lorawan specification for more details

This way you can highlight some device with a bad behavior. Some examples:
- Too much Join request/Accept
- No data uplink,
- Data uplink with empty payload (can be seen with a device not respecting the max Lorawan max payload size)
- The device never acknowledged the downlink with confirmed mode (the Ackbit should be set to true in the next data uplink)
/!\ Note that these information are very useful to make the link with device statuses used by Live Objects device manager (Registered, Initializing, Initialized, Activated, etc… see the list here)
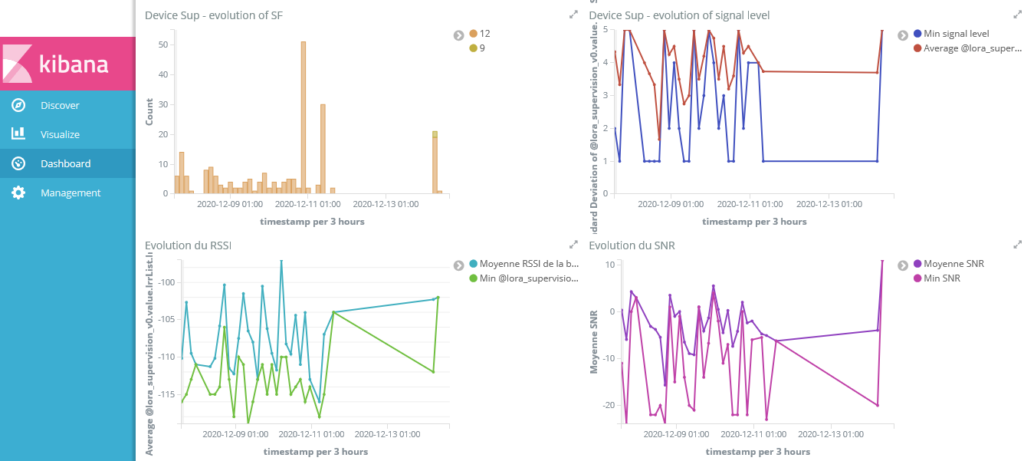
Now, you are suspecting some network coverage issues, you’re facing to frame loss, or you want to know if these issues concern a part of your fleet and which one? So let’s use Kibana.
Kibana is an option of LoRa Premium offer.
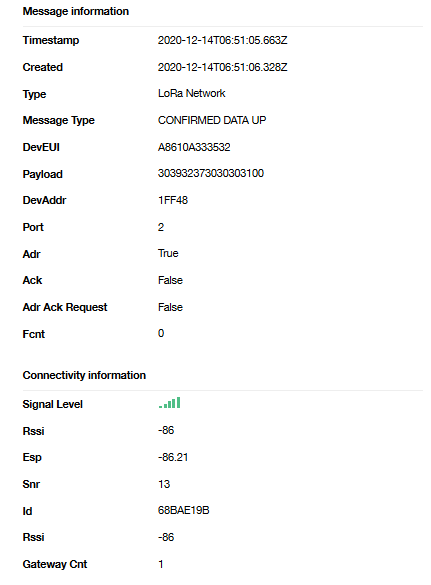
Each message issued by devices contain precious information about network conditions. In particular look at this ones:
- rssi, snr, esp: indicate if the radio conditions are good or not. If not, this could point out a problem of coverage, but can also indicate some local perturbations in particular if the ratio signal/noise is bad
- Sf: The spreading factor which is effort made by the device to reach the network. It can have several meaning: A problem of coverage or a misconfiguration of the device, and can have a strong impact on the device battery lifetime.
- signalLevel: To ease the evaluation of the radio quality, Orange computes this KPI based on the previous ones. From 1 which is very bad to 5 which is very good
- gatewayCnt : number of gateways that relayed the message. A poor density of gateway may indicate a weak of the local coverage
- missingFrameCounter: Number of frames that are missing since the last uplink received. This counter is based on the LoRa frame counter incremented by the device.
You can rely on many other information stored in the data message to aggregate per location, per device, group of device and build meaningful dashboards.
 B2B "IoT enthusiasts" group
 Live Objects on GitHub
 Tutorials
 Orange Business